bpp_identifier — Example output
This folder is the full output bundle produced by running bpp_identifier on the example overlay in ../example_input/. Each file below is generated automatically by the GUI into a time-stamped save directory; the set shown here is what you would see on disk after a single successful run.
Outputs are grouped roughly into three tiers:
- Input echo — the overlay that was loaded (kept alongside the outputs for reproducibility).
- Segmentation context — intermediate masks and overlays that let you spot-check how cell boundaries and the interface band were identified.
- Per-feature masks + summary — the three morphology masks (bridges, projections, protrusions) and an Excel summary with per-run counts / parameters.
- 📄 02-12-2026-Rescues-Code-S1-S3-Selected_S1-07_overlay.tif – Download
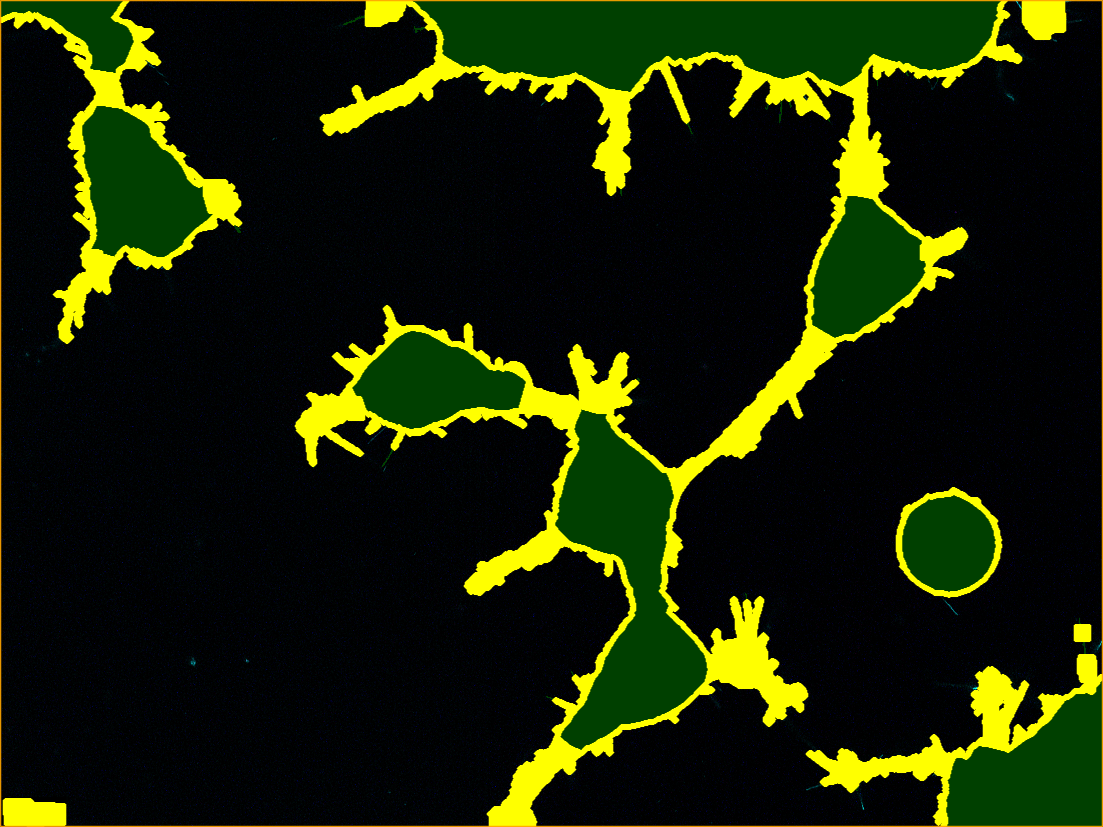
- 📄 1-cell_and_interface_mask.png – Download
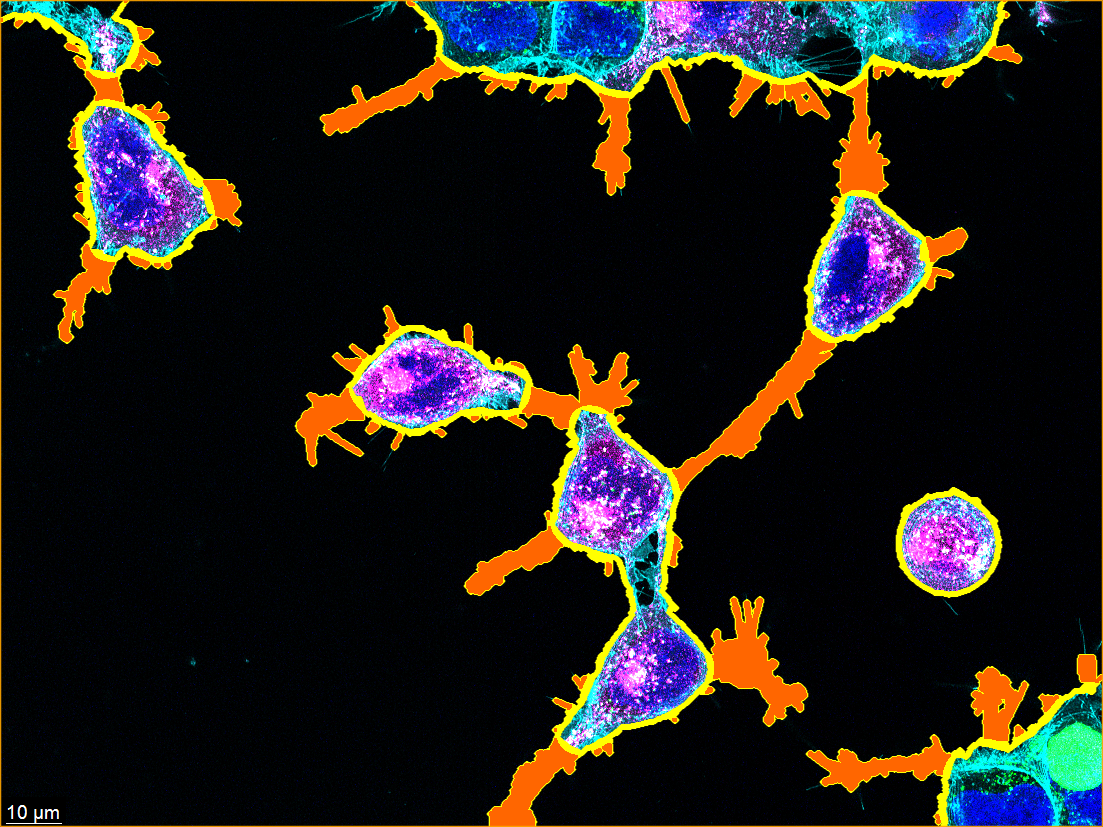
- 📄 2-bpp_overlay.png – Download
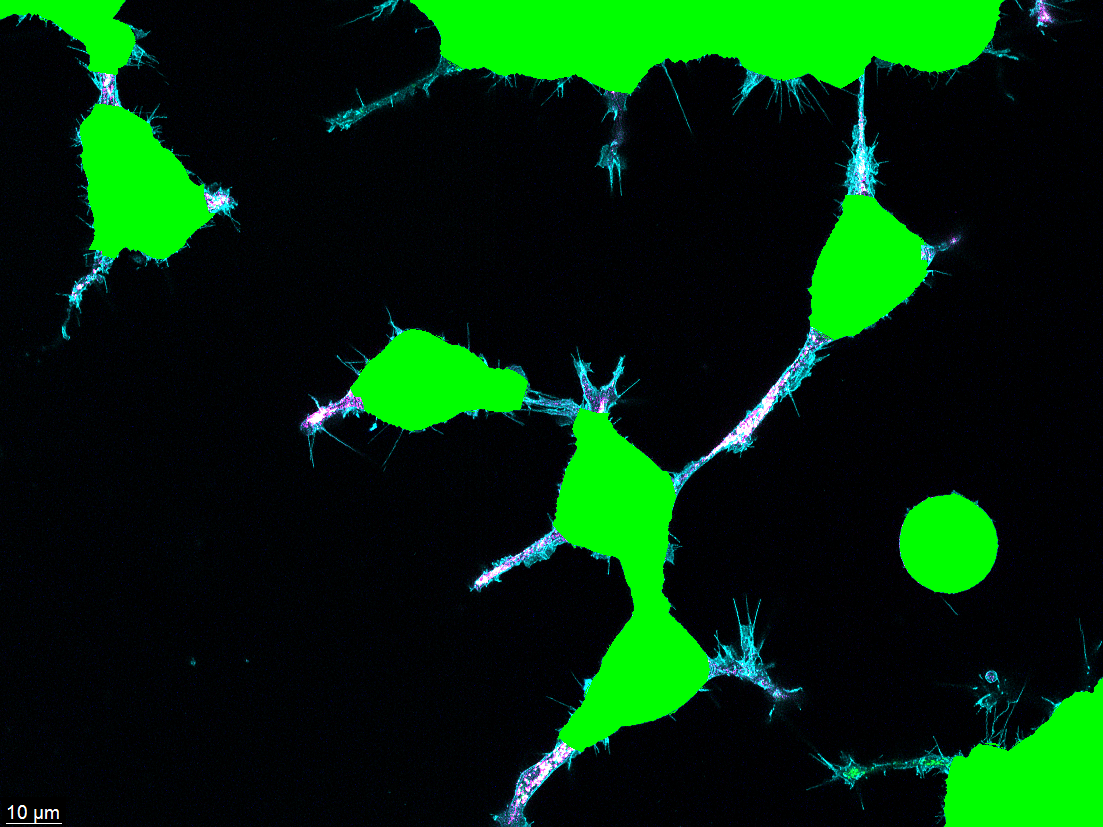
- 📄 3-cell_overlay.png – Download
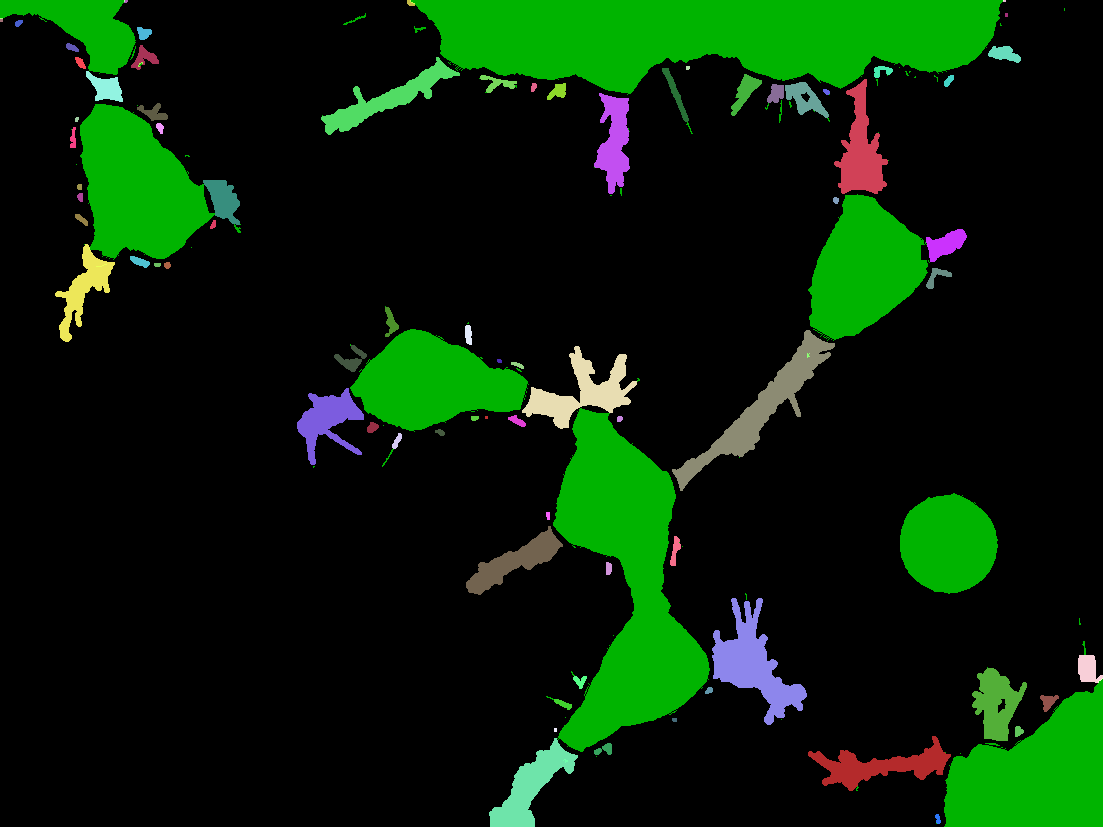
- 📄 4-cell_and_bpp_mask.png – Download
- 📄 5-bridge_mask.png – Download
- 📄 6-projection_mask.png – Download
- 📄 7-protrusion_mask.png – Download
- 📄 run_summary.xlsx – Download

📜 Files in this folder
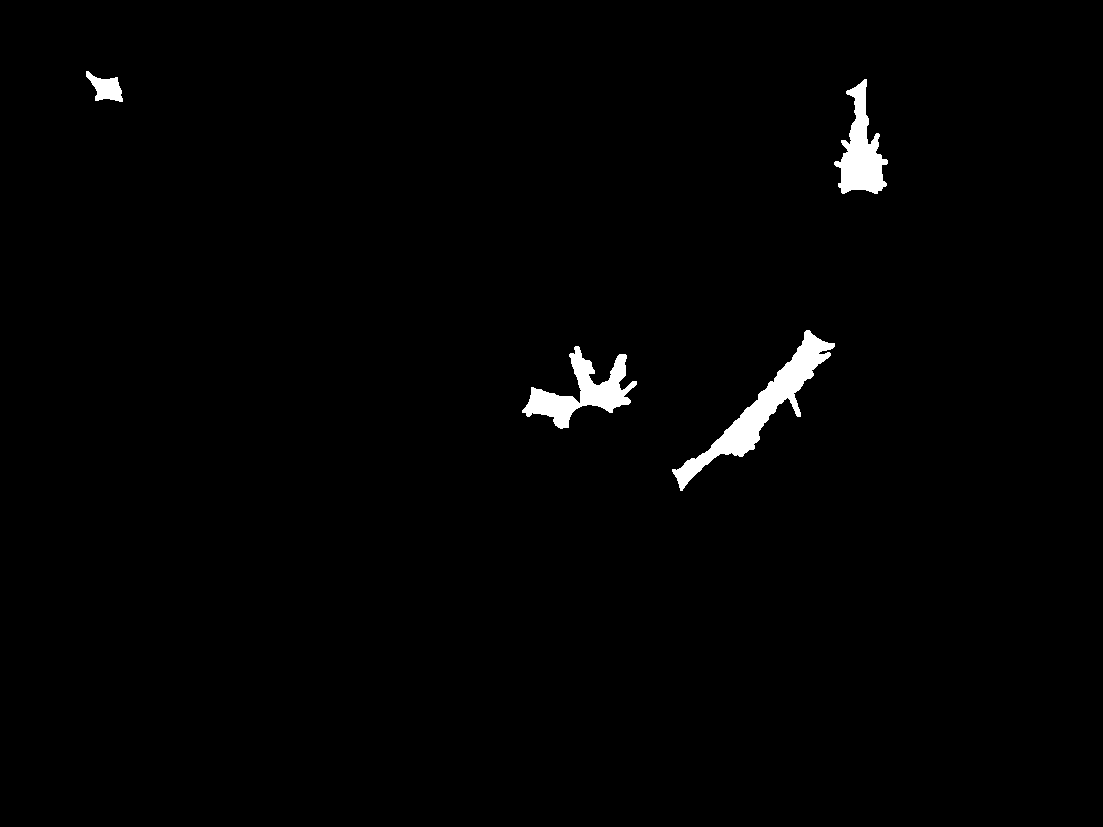
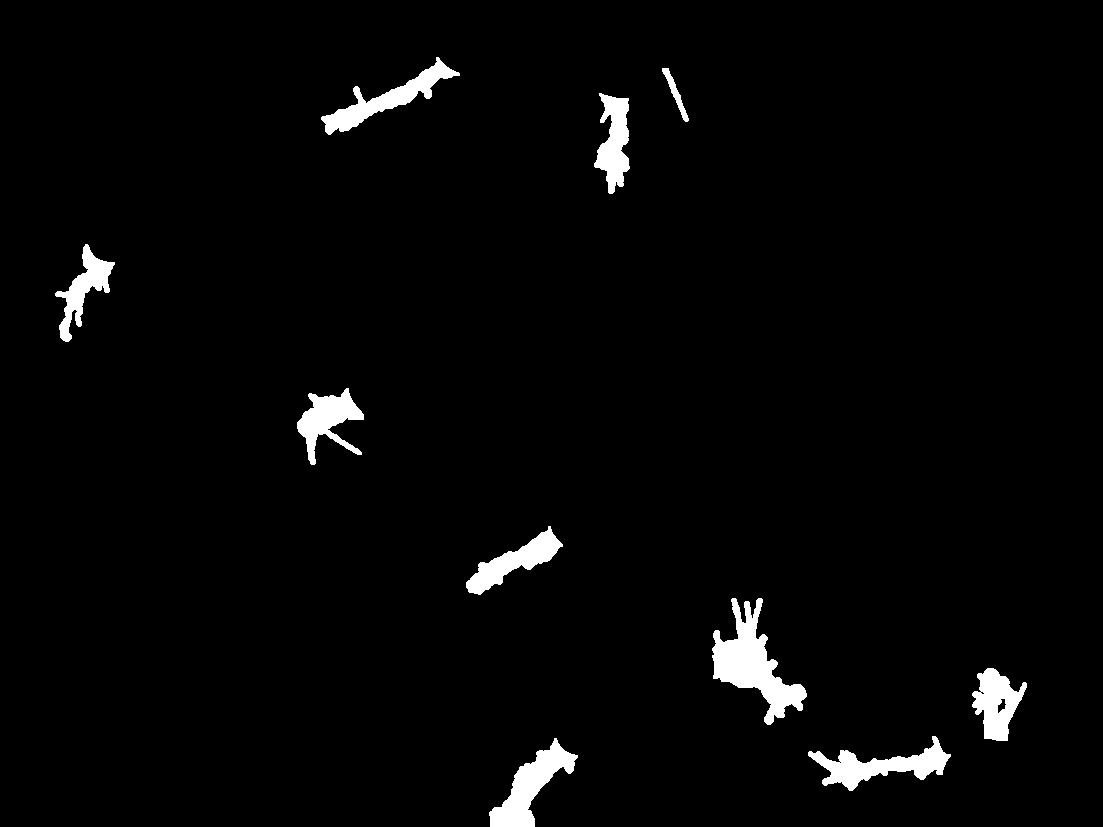
02-12-2026-Rescues-Code-S1-S3-Selected_S1-07_overlay.tif— Copy of the input overlay that drove this run (kept next to the outputs so a viewer can open the raw image and the annotated output side-by-side without hunting through folders).1-cell_and_interface_mask.png— First segmentation checkpoint: a binary / color mask showing the detected cells plus the cell–cell interface band that bpp_identifier will later scan for boundary features.2-bpp_overlay.png— Full color overlay of the original image with bridges, projections, and protrusions drawn on top in their canonical colors. This is the figure-ready summary image for the run.3-cell_overlay.png— Original image with the cell segmentation contours burned in (no bpp annotations). Useful as a sanity check on the upstream threshold / contour parameters.4-cell_and_bpp_mask.png— Composite debug mask combining the cell / interface mask with the bpp detections on one image, used by the developer toggles (enable_interface_islands,enable_green_fragment_to_interface) to diagnose mis-assigned features.5-bridge_mask.png— Binary mask of detected bridges — narrow cytoplasmic links that span the gap between two otherwise-separate cell regions.6-projection_mask.png— Binary mask of detected projections — outward extensions from a cell boundary (filopodia-like structures).7-protrusion_mask.png— Binary mask of detected protrusions — localized bulges or blebs on the cell boundary.run_summary.xlsx— Per-run Excel summary: parameters used (thresholds,max_r, hole-area cutoffs,edge_margin) plus the counts and size statistics for each of the three feature classes. One workbook per run.