vesicle_colocalization_quantifier — Example output
This folder is the full output bundle produced by running vesicle_colocalization_quantifier on the two-channel inputs in ../example_input/. The GUI writes one time-stamped output_<timestamp>/ directory per run; the files below are the contents of that directory for the example run.
Outputs come in two symmetric sets — one per channel (ch01_SV_* and ch02_SV_*) — plus a single run-level log:
- Per-channel segmentation images (4 per channel):
masked,contours,overlay, andoverlap_on_masked. These let you see exactly what each channel contributed to the overlap calculation and where the co-localized pixels fall. - Run log (
vesicle_coloc_overlap_log_<timestamp>.txt): a plain-text audit record of the parameters used and the quantitative overlap results from this run.
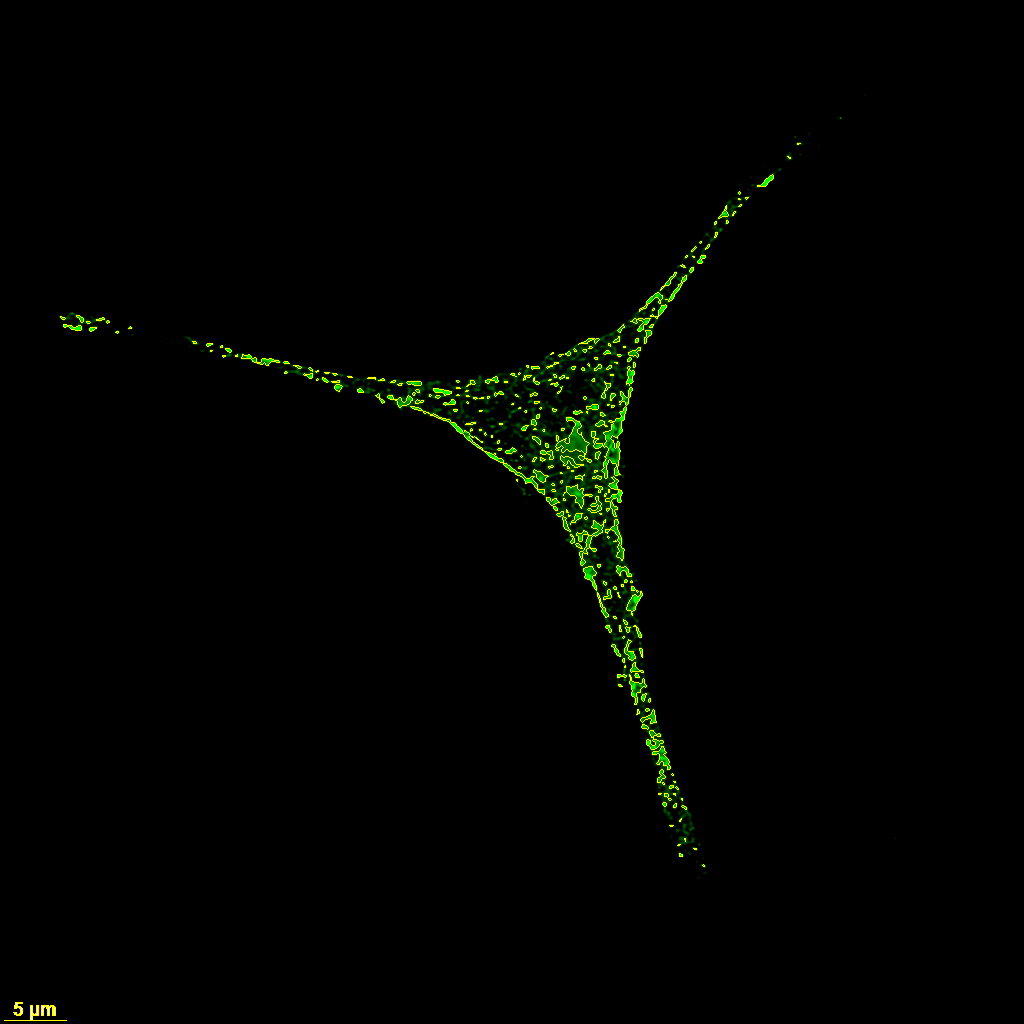
- 📄 Maximum Projection_ch01_SV_contours.png – Download
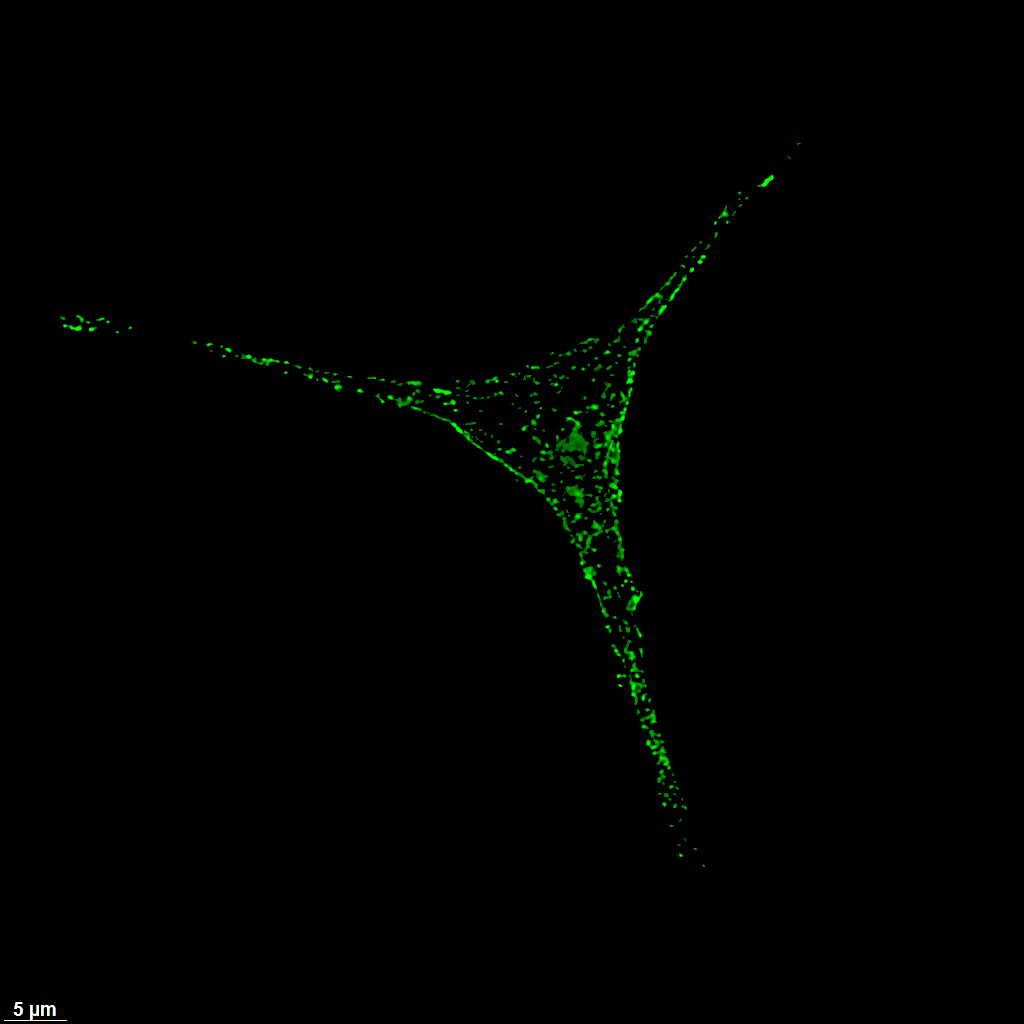
- 📄 Maximum Projection_ch01_SV_masked.png – Download
- 📄 Maximum Projection_ch01_SV_overlap_on_masked.png – Download
- 📄 Maximum Projection_ch01_SV_overlay.png – Download
- 📄 Maximum Projection_ch02_SV_contours.png – Download
- 📄 Maximum Projection_ch02_SV_masked.png – Download
- 📄 Maximum Projection_ch02_SV_overlap_on_masked.png – Download
- 📄 Maximum Projection_ch02_SV_overlay.png – Download
- 📄 vesicle_coloc_overlap_log_20260411_204330.txt – Download


📜 Files in this folder
Channel 01 (ch01_SV)
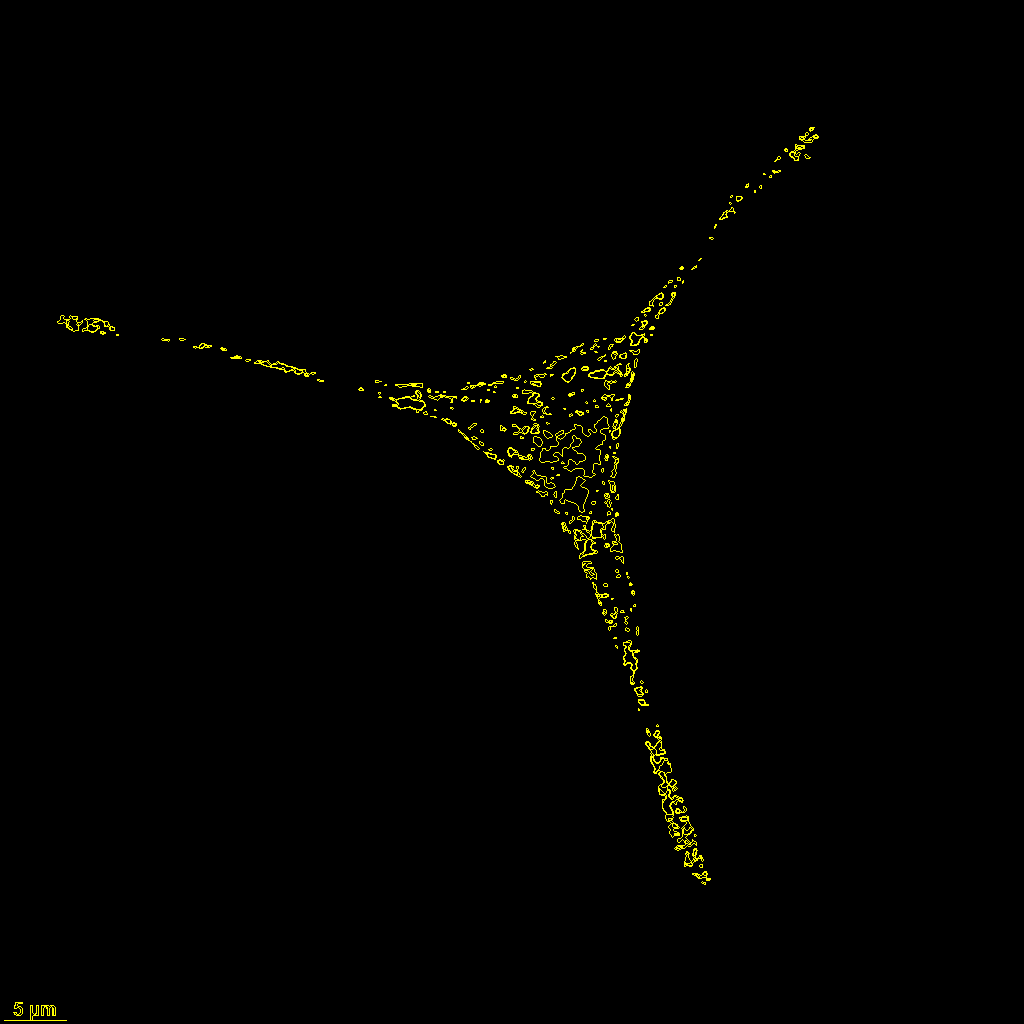
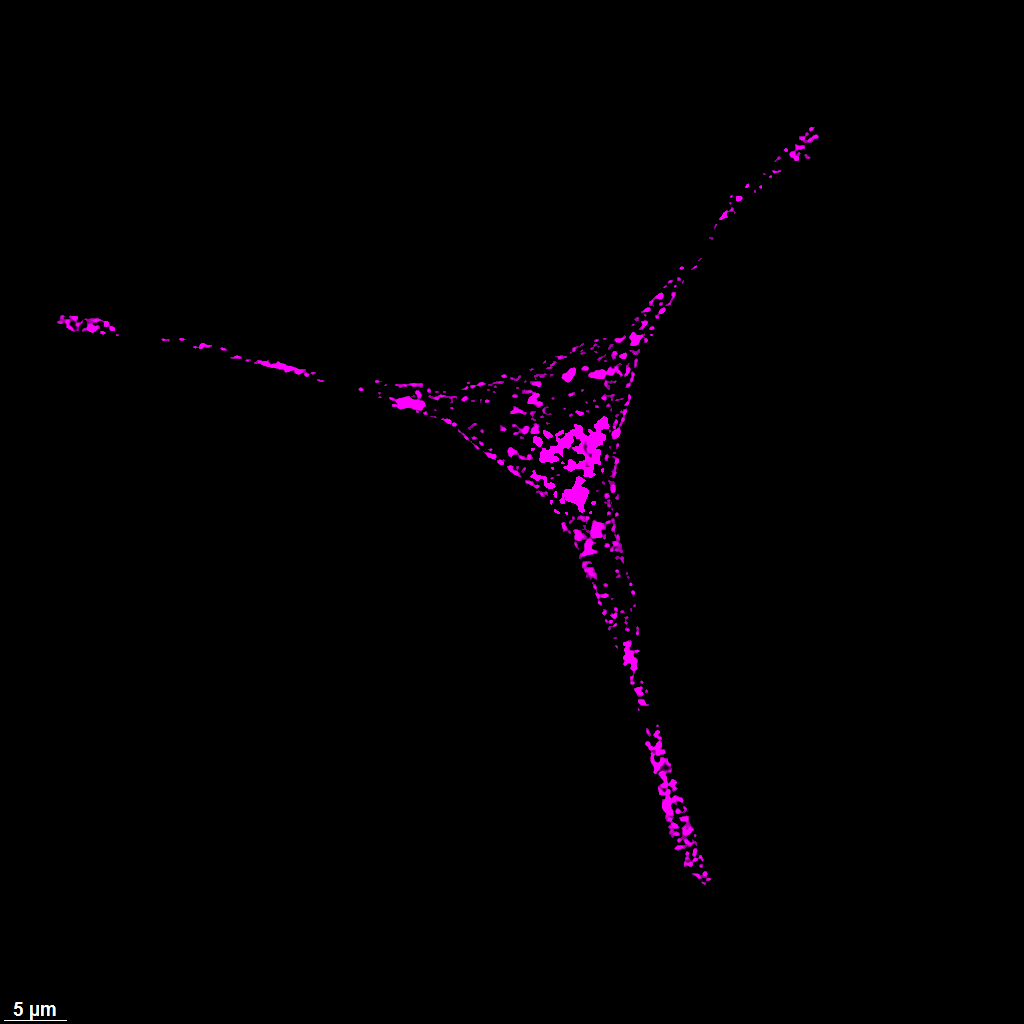
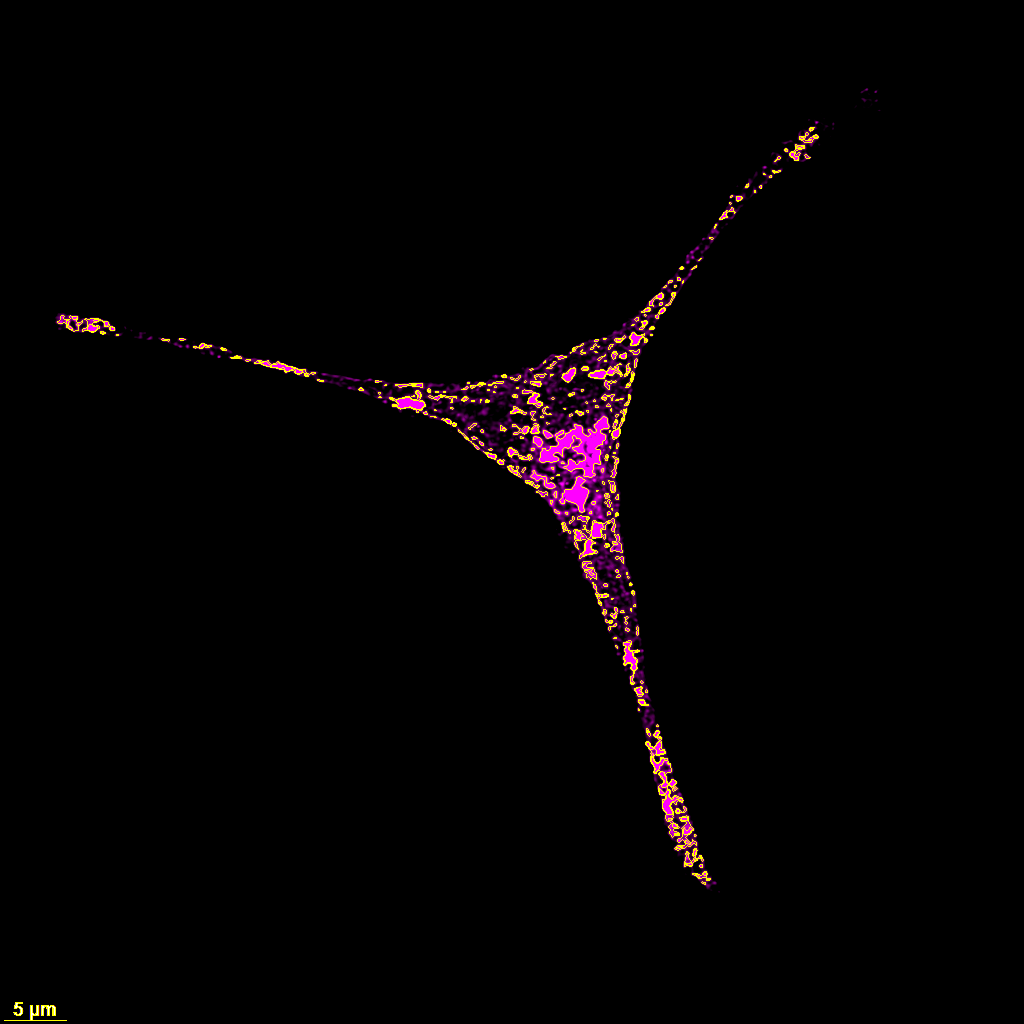
Maximum Projection_ch01_SV_masked.png— The original ch01 image with every pixel below threshold zeroed out. Shows exactly the pixels that survived the ch01 threshold and therefore contributed to the ch01 mask going into the overlap calculation.Maximum Projection_ch01_SV_contours.png— The ch01 contours drawn alone on a black background. Useful for counting or inspecting individual ch01 vesicles without the underlying intensity distracting the eye.Maximum Projection_ch01_SV_overlay.png— The original ch01 image with the detected ch01 contours drawn on top. The headline QA figure for ch01 segmentation: every detected vesicle should have a contour, and every contour should sit on a real vesicle.Maximum Projection_ch01_SV_overlap_on_masked.png— The ch01 masked image with the overlap pixels (ch01 ∩ ch02) highlighted in color. This is the per-channel visualization of co-localization: wherever color shows up is where ch02 vesicles overlap with ch01.
Channel 02 (ch02_SV)
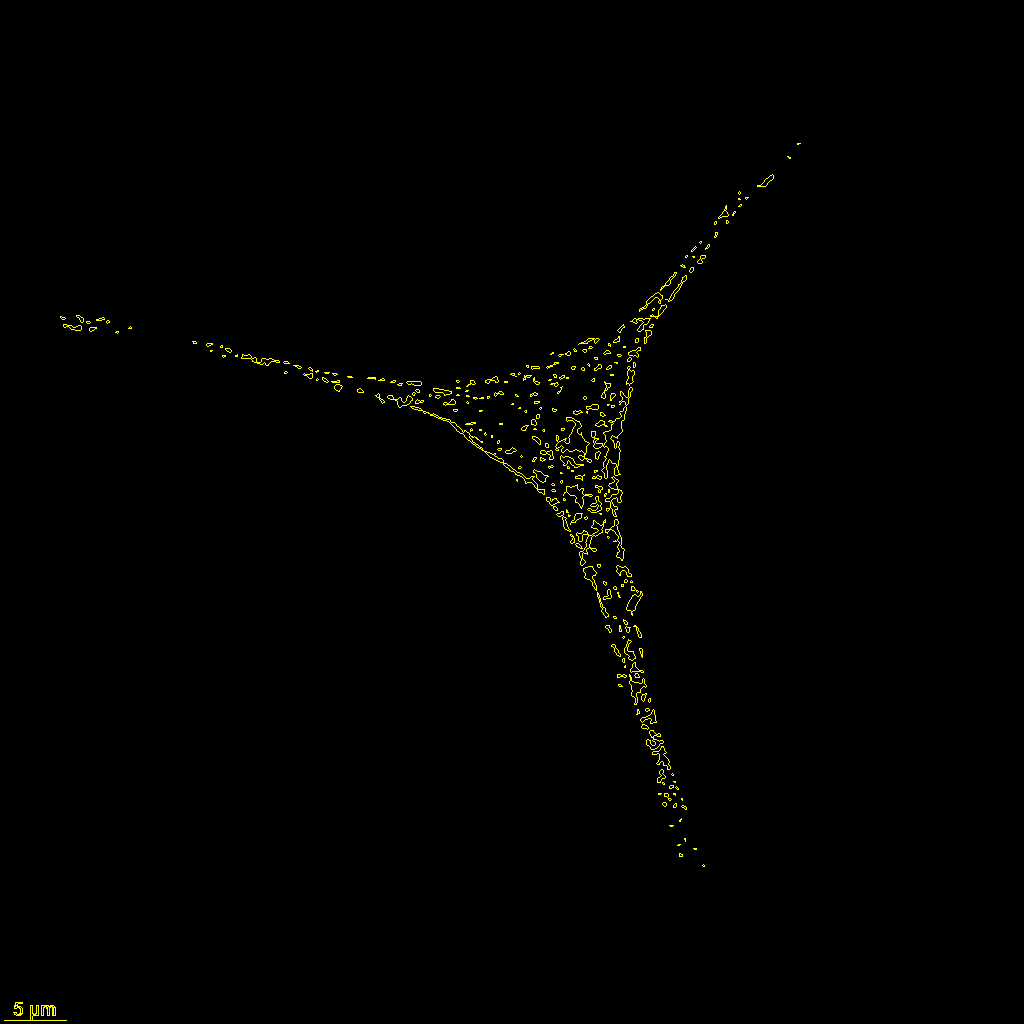
Maximum Projection_ch02_SV_masked.png— Same idea as the ch01 masked image, for ch02: the original ch02 intensity restricted to pixels above the ch02 threshold.Maximum Projection_ch02_SV_contours.png— ch02 contours on a black background.Maximum Projection_ch02_SV_overlay.png— ch02 original with detected ch02 contours drawn on top. Primary QA figure for ch02 segmentation.Maximum Projection_ch02_SV_overlap_on_masked.png— ch02 masked image with the overlap pixels highlighted. The mirror of the ch01 overlap figure, showing co-localization from the ch02 point of view.
Run-level audit log
vesicle_coloc_overlap_log_<timestamp>.txt— Plain-text record of this specific run: timestamp, paths to the two input channels, the thresholds and contour-size / line-width parameters used, and the headline metrics —Total Pixels Image 1,Total Pixels Image 2,Overlapping Pixels,Fraction Overlap Ch1, andFraction Overlap Ch2. Because the filename is time-stamped (_YYYYMMDD_HHMMSS.txt), repeat runs always produce a new log without overwriting previous ones.