vesicle_triangulator — Example output : mixed
The joint, cross-channel outputs of the example run. The triangulator takes the ch1 and ch2 point centroids (from ../ch1/ and ../ch2/), builds a 3D convex-hull / Delaunay triangulation with the Isom-Lab compGeometry + convexHull3D_2_1 stack, then classifies every edge as either “same” (both endpoints from the same channel) or “mixed” (endpoints from different channels — the biologically interesting cross-channel vesicle links). The files below are the headline figures and statistics of that joint pass.
- 📄 mixed_hist_mixed_edges_per_vertex.png – Download
- 📄 mixed_hist_mixed_edges_per_vertex.xlsx – Download
- 📄 mixed_hist_same_edges_per_vertex.png – Download
- 📄 mixed_hist_same_edges_per_vertex.xlsx – Download
- 📄 mixed_vertex_mixing_summary.xlsx – Download
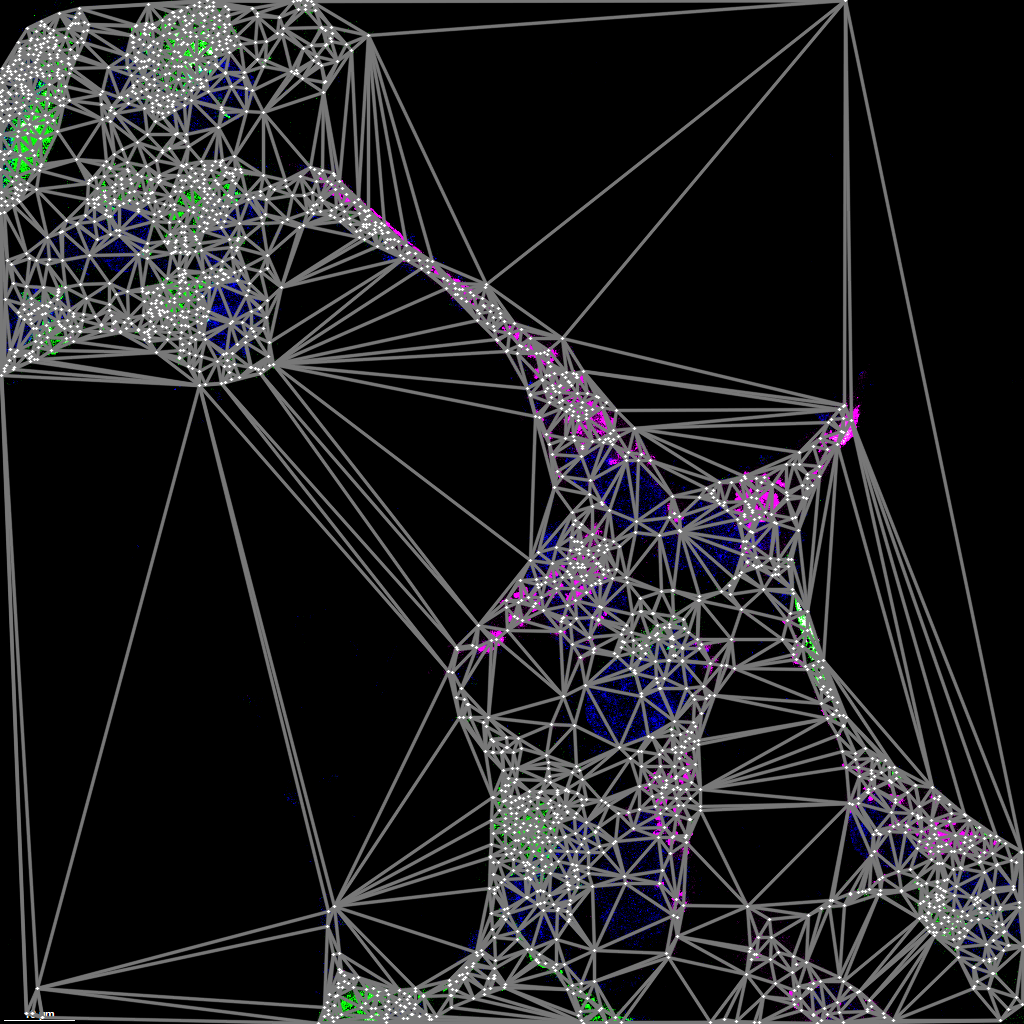
- 📄 tri_full.png – Download
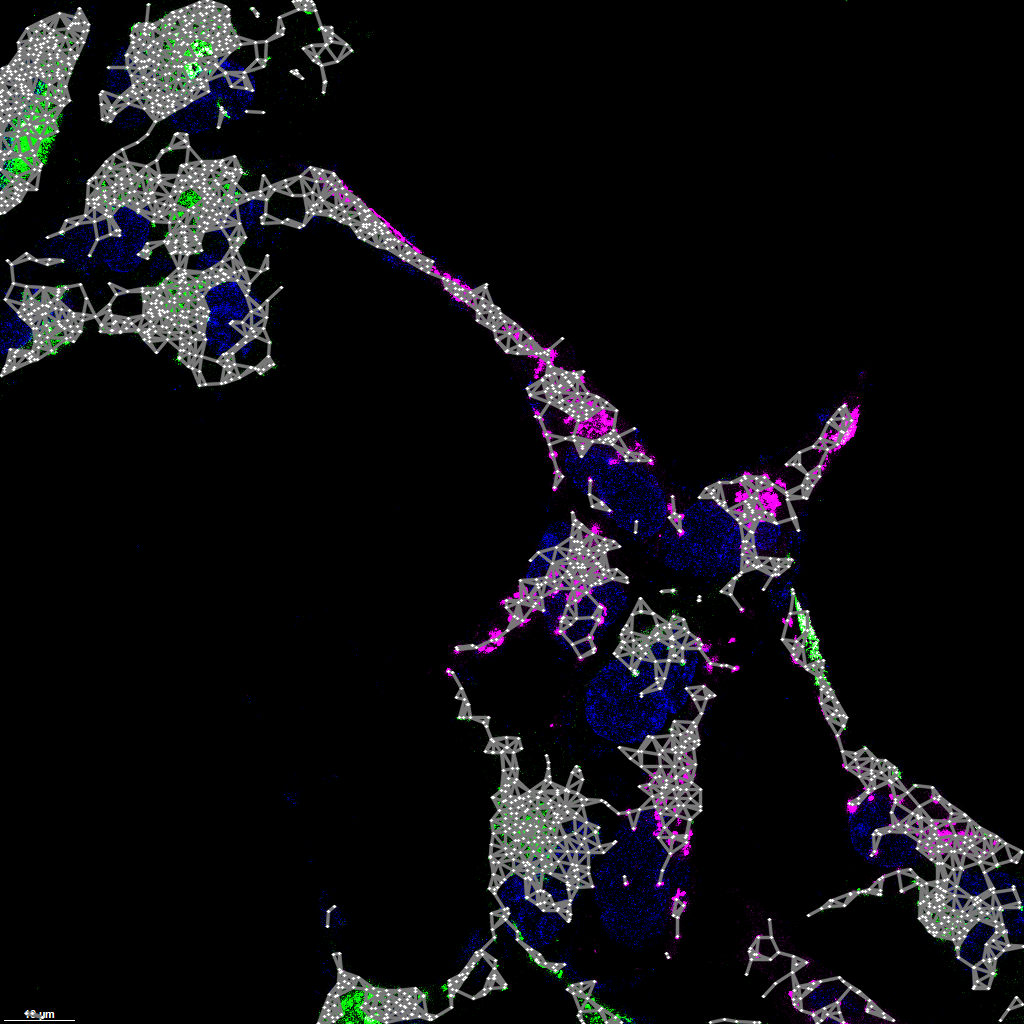
- 📄 tri_trimmed.png – Download
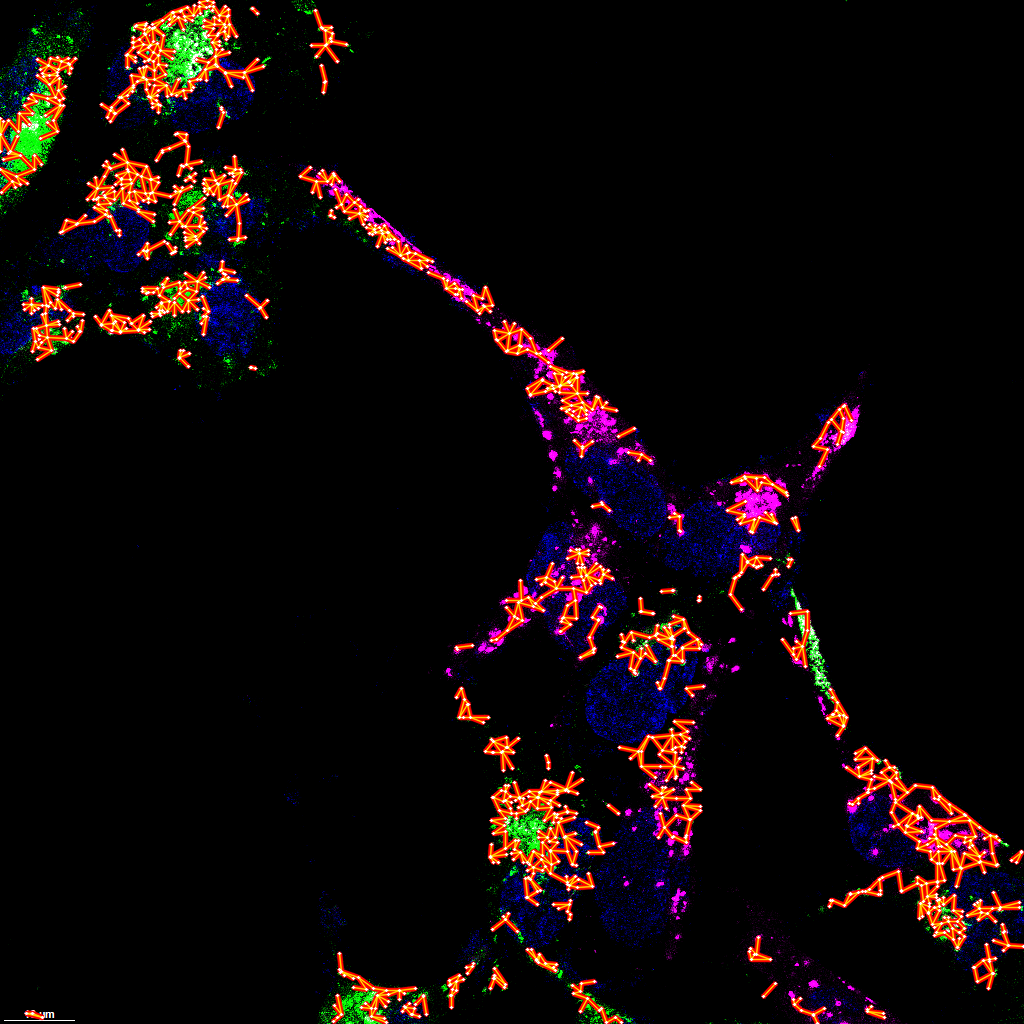
- 📄 tri_trimmed_mixed_edges.png – Download
- 📄 tri_trimmed_mixed_vs_same_edges.png – Download



📜 Files in this folder
tri_full.png— The untrimmed Delaunay triangulation over the union of ch1 + ch2 points, drawn on top of the input overlay. All edges present, no filtering.tri_trimmed.png— Same triangulation after applying the GUI’s trim rule (e.g., removing edges above a maximum length / boundary-hull filter), so spurious long edges across empty space don’t dominate the figure.tri_trimmed_mixed_edges.png— Trimmed triangulation with only the mixed (cross-channel) edges drawn. This is the headline figure for cross-channel vesicle relationships.tri_trimmed_mixed_vs_same_edges.png— Trimmed triangulation with both same-channel and mixed edges drawn in contrasting colors, so you can see at a glance how the cross-channel connections sit within the full same-channel skeleton.mixed_hist_mixed_edges_per_vertex.png/.xlsx— Histogram (PNG) and backing data (XLSX) for the number of mixed edges incident on each vertex. Indicates how many cross-channel partners each vesicle has.mixed_hist_same_edges_per_vertex.png/.xlsx— Histogram + data for the number of same-channel edges incident on each vertex. Useful as a per-channel baseline to compare against the mixed-edges distribution.mixed_vertex_mixing_summary.xlsx— Per-vertex summary workbook: for every vesicle, the counts and fractions of mixed vs same edges, plus top-line summary rows likefraction_vertices_with_mixed_edgesandfraction_vertices_without_mixed_edges— the primary quantitative result of the run.